An availability target is useful only when everyone knows what is being measured. “The system must be available” sounds precise, but it leaves the most important questions unanswered: available to whom, for which operation, from where, and with what result?
A process can be running while users cannot sign in. An API can return 200 OK while serving stale or incomplete data. A checkout can accept an order but fail to persist the payment reference. Infrastructure uptime is evidence, but it is not automatically evidence of a successful user journey.
Start with the journey, then choose the number.
Define a successful outcome
Choose a small set of journeys that matter to users and the business. For an ERP application, examples might include opening a sales order, posting an approved transaction, or generating a report. Each journey needs a success condition and a measurement boundary.
A useful definition states:
- where measurement begins and ends;
- which users, regions, tenants, or traffic classes are included;
- which responses count as successful;
- whether correctness and freshness are part of success;
- the latency threshold, if a very slow response is considered unavailable;
- planned exclusions, if any, and why they exist.
This turns a vague infrastructure objective into an observable service-level indicator. A request-based indicator can be expressed as successful eligible requests divided by all eligible requests during the observation window. A journey spanning several calls may need synthetic checks or application events rather than one endpoint metric.
Do not silently remove difficult traffic from the denominator. If maintenance windows, unsupported clients, abusive traffic, or dependency failures are excluded, document those assumptions. Otherwise, two teams can publish the same percentage while measuring materially different experiences.
What the availability “nines” mean
“Three nines” means 99.9% availability under a particular definition and observation window. It does not, by itself, promise a specific outage duration. The familiar downtime conversions are arithmetic illustrations, not operational guarantees.
For example, if—and only if—you assume a 30-day window containing 43,200 minutes, then:
- 99% allows 432 unsuccessful minutes;
- 99.9% allows 43.2 unsuccessful minutes;
- 99.99% allows 4.32 unsuccessful minutes.
Change the window, denominator, or treatment of partial failures and the interpretation changes. Request-based availability also does not map neatly to contiguous minutes: one percent of requests could fail in a short total outage, through intermittent errors, or only for one high-volume tenant.
Higher nines usually narrow the room for failure, but they do not say where investment should go. The engineering work might be safer deployments, dependency isolation, capacity, database recovery, or faster detection. The indicator helps expose the gap; it does not prescribe the architecture.
Reliability is broader than uptime
Availability asks whether the service can provide the defined outcome at a point in time. Reliability asks whether it continues to perform correctly under stated conditions over time. A service that frequently produces incorrect results and is quickly restarted is not reliable simply because the host uptime is high.
Reliability therefore includes failure frequency, recovery behavior, correctness, data integrity, and predictable operation under expected load. It also depends on explicit conditions. A service may be reliable within a designed capacity envelope and unreliable beyond it; hiding that envelope makes the claim less useful.
When user impact is unclear or the system’s bottlenecks are disputed, a focused performance and reliability assessment can connect request paths, dependency limits, and recovery behavior to the outcomes that need protection.
Use MTBF and MTTR carefully
For a repairable service over a defined observation period:
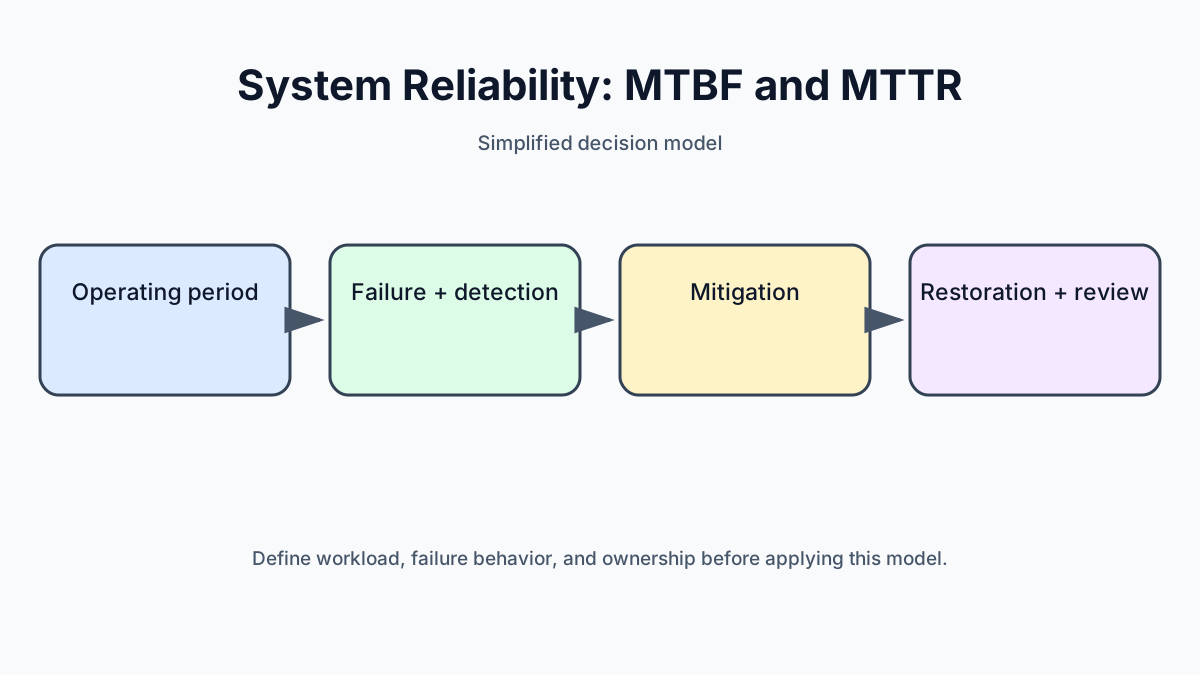
- Mean time between failures (MTBF) can be estimated as total operating time divided by counted failures.
- Mean time to recovery or restore (MTTR) can be estimated as total completed recovery duration divided by recovered incidents.
These definitions require boundaries. What qualifies as a failure? Does the recovery clock begin when impact starts, when monitoring detects it, or when an incident is declared? Does it stop at mitigation, full restoration, or completion of the permanent repair?
The simplified steady-state expression A = MTBF / (MTBF + MTTR) assumes alternating operating and repair periods with consistently defined boundaries. It can help reason about a repairable component. It is not a universal probability of reliability, and it should not replace direct measurement of user-facing success.
Averages also hide distribution. Two services can have the same MTTR while one recovers consistently and the other has many quick incidents plus one severe event. Keep percentiles, individual incident timelines, affected journeys, and impact duration alongside the mean.
Map the complete incident interval
Separate the stages of an incident:
- failure begins;
- monitoring detects a symptom;
- responders understand enough to act;
- mitigation reduces user impact;
- service is restored to the agreed condition;
- follow-up work removes or reduces the cause.
This separation reveals where reliability work can help. Better observability may reduce detection time. A tested rollback may reduce mitigation time. Isolation or graceful degradation may reduce the affected scope even if the underlying failure still occurs. A durable corrective action may reduce recurrence.
Redundancy is valuable only when failover works under the expected failure mode. Retries are valuable only when they are bounded and safe. Health checks help only when they represent readiness rather than superficial process life. Reliability is created by the behavior of the whole path, not by a list of components labelled “highly available.”
Design from the user journey backward
Once the critical journey and target are explicit, identify every dependency required to complete it. Ask how each dependency fails, how quickly that failure becomes visible, and whether the journey can continue in a reduced mode. Define overload behavior before capacity is exhausted. Prefer bounded queues and clear rejection over uncontrolled latency that consumes every worker.
Release design matters too. Use incremental rollout, compatibility across versions, production verification, and a rollback or forward-fix path. A deployment system that reports success because containers started may miss a broken business workflow.
The ERP performance and reliability case study illustrates the broader approach: follow the actual workflow, inspect the system boundaries involved, and base changes on evidence rather than a generic availability label.
Make the number support decisions
An availability objective should help teams decide when to invest in resilience, when to slow risky change, and which failure modes deserve attention. It should not become a vanity percentage detached from incidents that users actually notice.
Review definitions when the product changes. New regions, asynchronous workflows, integrations, and stricter freshness needs can invalidate an old indicator. Keep assumptions near the metric, and pair the number with incident narratives and recovery evidence.
The durable principle is simple: define the successful journey first. Then choose indicators, targets, and reliability practices that protect it. The number becomes meaningful because its boundaries are visible—and because the team can connect it to concrete engineering action.